Hi, I'm Soumya ,
Welcome to my Data Analyst Portfolio
Highly organized and proactive data analyst with experience translating raw data into actionable insights. Proficient in utilizing SQL, Tableau, and Excel for comprehensive data analysis, dynamic KPI metrics visualization, and the creation of insightful ad-hoc reports.

SKILLS
SQL
Data profiling and cleaning data, working with structured and partially structured datasets using aggregations, window functions, and data modeling.
Databases: MySQL,PostgreSQL
Matplotlib & Seaborn
Visualizing distributions, trends, and relationships within data using bar charts, line plots, histograms, heatmaps, and pair plots to support exploratory data analysis and communicate findings effectively.
Tableau
Creating KPI dashboards from data analysis to deliver business insights and recommendations to primary stakeholders.
Power BI
Designing interactive and dynamic dashboards, integrating multiple data sources, using DAX functions for custom calculations, and delivering insights for data-driven decisions.
PROJECTS

STACKOVERFLOW DEVELOPER SURVEY DATA ANALYSIS
Performed comprehensive analysis of the Stack Overflow Developer Survey using a combination of SQL and Python. Developed a suite of SQL queries to explore trends and test hypotheses across key dimensions such as country, age, education level, programming experience, technology preferences, job satisfaction, and AI adoption. Cleaned and prepared the data using Pandas, and utilized Matplotlib and Seaborn to create clear, insightful visualizations that highlighted patterns in developer demographics, tech stack usage, and professional outlook.The analysis provided actionable insights into the developer community, revealing trends in technology adoption, job satisfaction, and the impact of AI on development practices.
Python • Pandas • SQL • Matplotlib • Seaborn
VIEW PROJECT
WALMART SALES ANALYSIS
This project focuses on analyzing Walmart's point-of-sale data to address key business questions using SQL. It includes: • Trend analysis by branch, category, and time • Profit and performance comparisons across cities • Behavior segmentation by time of day • Revenue change detection between 2022 and 2023 Tools used: SQL (PostgreSQL), window functions, date/time parsing, aggregation, CTEs. Insights were designed to support decision-making in marketing strategy, store operations, and product planning.
Python • Pandas • SQL • Matplotlib • Seaborn
VIEW PROJECT
E-COMMERCE SALES PERFORMANCE ANALYSIS
Analyzed an e-commerce dataset using SQL to uncover sales trends, customer behavior, and product performance. Key deliverables: • Total and average revenue by country and product • Monthly revenue trend and top customer profiling • Product bundling patterns (items frequently bought together) Used SQL CTEs, joins, aggregations, and window functions for efficient querying. Visualized results using Matplotlib and Seaborn for actionable business insights.
SQL • Python • Matplotlib • Seaborn
VIEW PROJECT
THE YELP DATASET
Conducted a comprehensive profiling and analysis of businesses and user data to establish correlations between user reviews and various metrics, including the number of fans, customer success rates, and business rating distributions across categories and locations.
PostgreSQL • SQL • Google Docs
VIEW PROJECT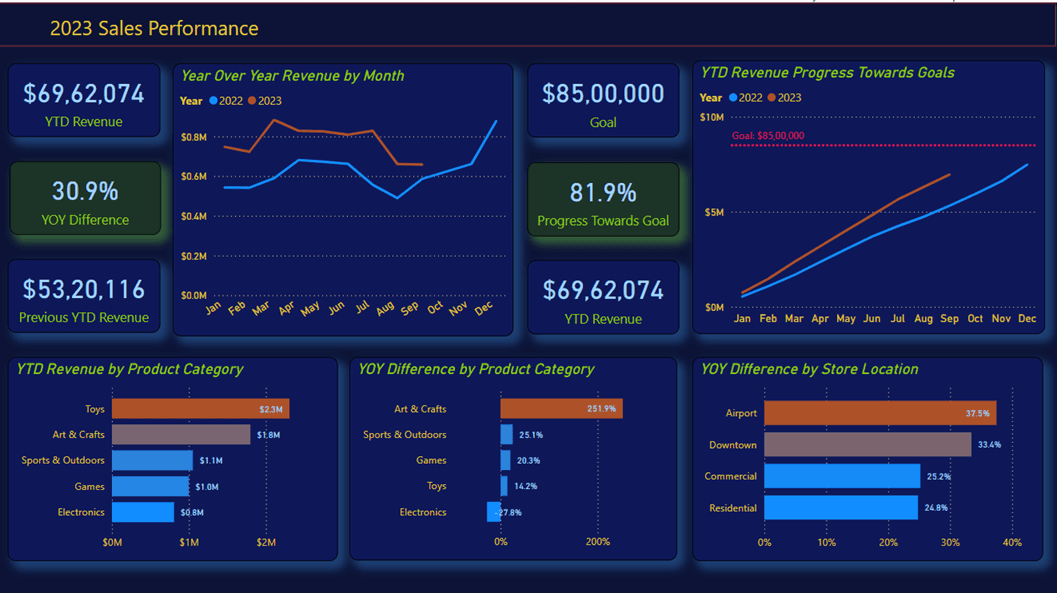
RETAIL SALES TRENDS & ANALYSIS
This Sales Performance Dashboard visualizes key metrics such as YTD revenue, YoY growth, and goal progress. It highlights revenue trends by month, product, and store, enabling deeper insights into high-performing categories and locations. The dashboard supports strategic decisions through clear comparisons and goal tracking.
POWER BI • SQL • Excel
VIEW PROJECT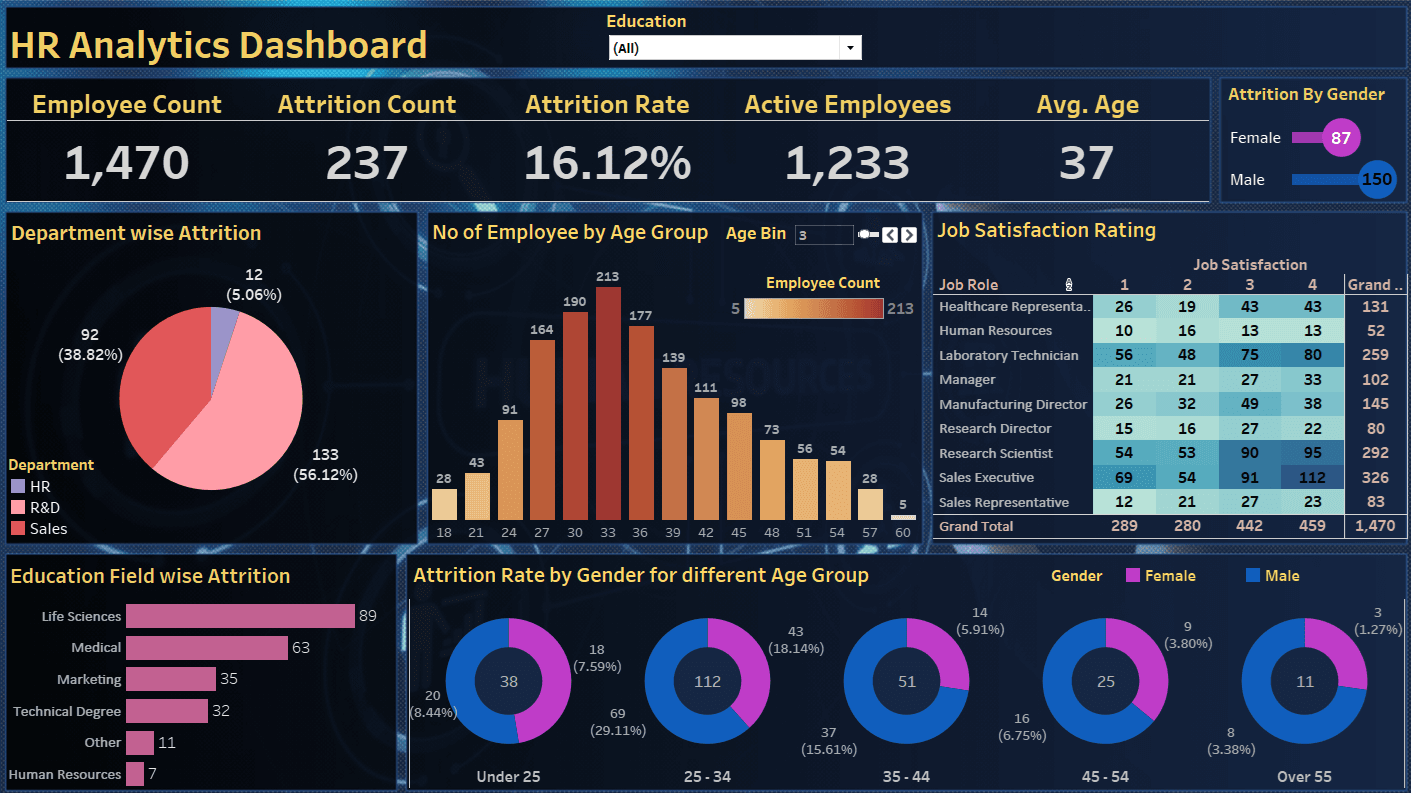
WORKFORCE RETENTION ANALYSIS
This HR Analytics Dashboard visualizes employee attrition using key metrics and trends across multiple organizational and demographic dimensions to help identify patterns and areas for HR intervention.
Tableau
VIEW PROJECT